Colorectal Cancer Data Dashboard
The American Cancer Society National Colorectal Cancer Roundtable’s Colorectal Cancer Data Dashboard (CRC Data Dashboard) offers an interactive geospatial view of data pertaining to colorectal cancer in the United States. Learn more about the Dashboard below.
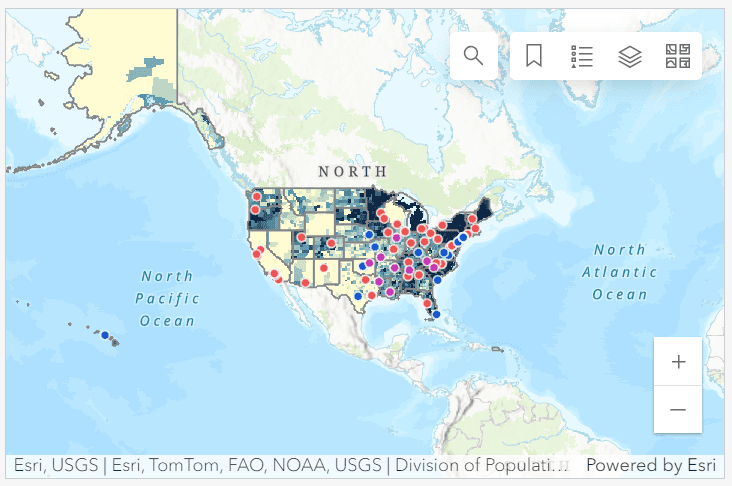
The CRC Data Dashboard is a dynamic national platform that integrates layers from multiple sources and allows you to interactively explore data using maps and graphs, including:
- CRC surveillance data (incidence rates, mortality rates)
- CRC screening rates
- Healthcare settings (Commission of Cancer hospitals, Federally Qualified Health Centers, National Cancer Institute Designated Cancer Centers)
- Demographics (age, race and Hispanic origin, gender identity and sexual orientation, poverty status, educational attainment)
- Additional health measures (smoking, binge drinking, obesity)
These maps can be used by researchers, public health professionals, policymakers, and others to understand and illustrate the burden of colorectal cancer in communities across the United States and assist in planning and tailoring interventions.
View the Video Tutorial to learn more about the CRC Dashboard, below.
Acknowledgement
The ACS NCCRT CRC Dashboard was compiled by the Geospatial Solutions Team, Digital Solutions, at the American Cancer Society in March 2024. The ACS NCCRT would like to thank members of the Geospatial Solutions Team, led by Dr. Liora Sahar, who generously dedicated their time and expertise to the development of this resource.
Citations and details about the data sources including links are available in the information panel of the Dashboard.
Questions? Please send your questions and comments to [email protected].
Explore More Resources

ACS Webinar: Turning Data Into Action with Early-Onset CRC Insights and Best Practices for CHCs
This webinar focused on on community health centers, providing CRC data, tangible tools, resources, and best practices to drive better outcomes.

2026 National Colorectal Cancer Awareness Month Webcast
This year’s webcast spot lit national achievements across the CRC community and provide the latest state of the field updates that guide our collective efforts to reduce CRC mortality and disparities.

Increasing Colorectal Cancer Screening in Rural Communities: A Practical Guide
This guidebook is designed to support key community partners in understanding and overcoming the unique challenges and common barriers to CRC screening faced in rural communities.