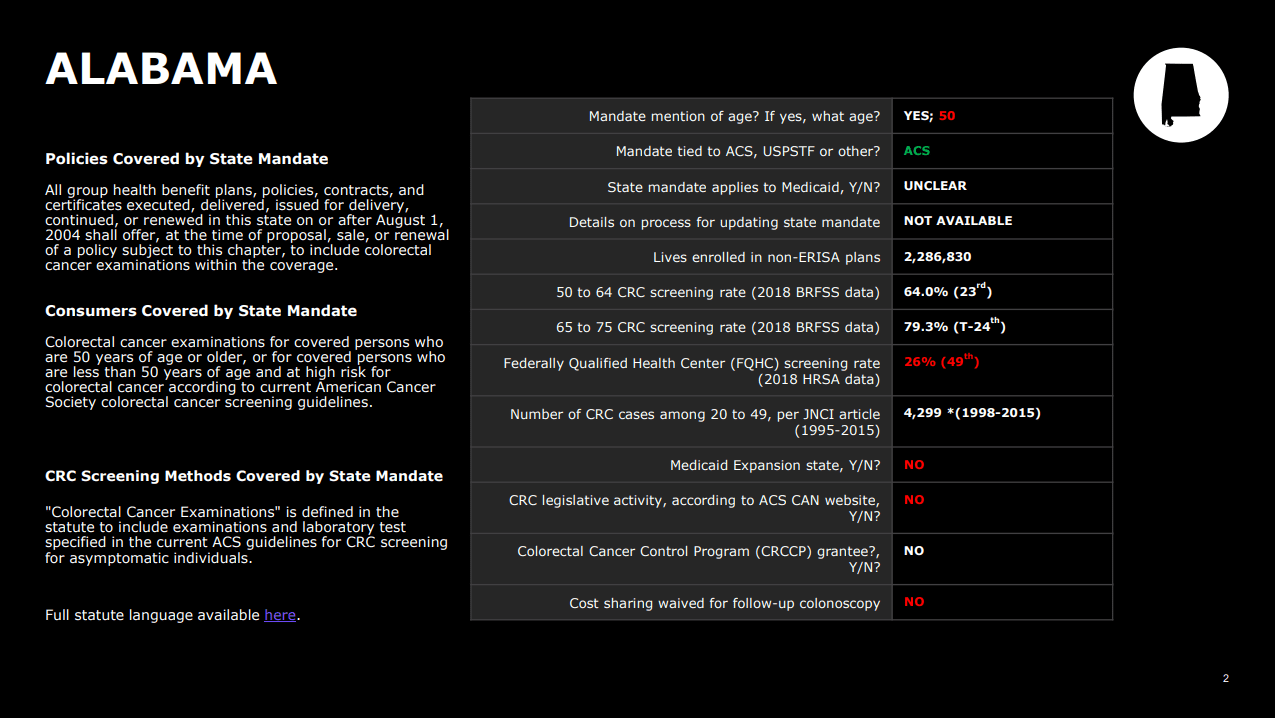
This resource, developed by Exact Sciences, provides a snapshot of the colorectal cancer screening landscape in each state while also putting into context how the different states compare with each other in a range of areas. While the majority of the information included is publicly available, it is difficult to find all this information in one place. This resource is intended to help people better understand what the CRC screening landscape – from coverage to screening rates to legislation – looks like in each state.
Evaluation: The last slide includes reference links for the included information. This involved considerable time and research across multiple websites and through research from Exact Sciences’ legal team.
Permissions: Made publicly available online by Exact Sciences.
Publication date: November 2019; updated August 2020
Post date: November 3, 2020
Contact: Submit comments, questions, and suggestions to Bryan Goettel: [email protected].
Explore More

ACS Webinar: Turning Data Into Action with Early-Onset CRC Insights and Best Practices for CHCs
This webinar focused on on community health centers, providing CRC data, tangible tools, resources, and best practices to drive better outcomes.

2026 National Colorectal Cancer Awareness Month Webcast
This year's webcast spot lit national achievements across the CRC community and provide the latest state of the field updates that guide our collective efforts to reduce CRC mortality and disparities.

Increasing Colorectal Cancer Screening in Rural Communities: A Practical Guide
This guidebook is designed to support key community partners in understanding and overcoming the unique challenges and common barriers to CRC screening faced in rural communities.